Better Coffee with Linux Part 1: Introduction
My project for the past few months has been adding a new temperature controller to my espresso machine. The stock machine has a brew thermostat that turns the boiler on below 99c and off above 115c. That’s a pretty wide range. I’ve found the ideal boiler temperature to be about 102c.
I didn’t measure the performance of the stock thermostat, but I did the next best thing. I coded up a quick program emulating the simple logic described above on a Raspberry Pi Pico. I logged the temperature via serial link, and plotted the data with Octave.
The results weren’t pretty, literally or metaphorically.
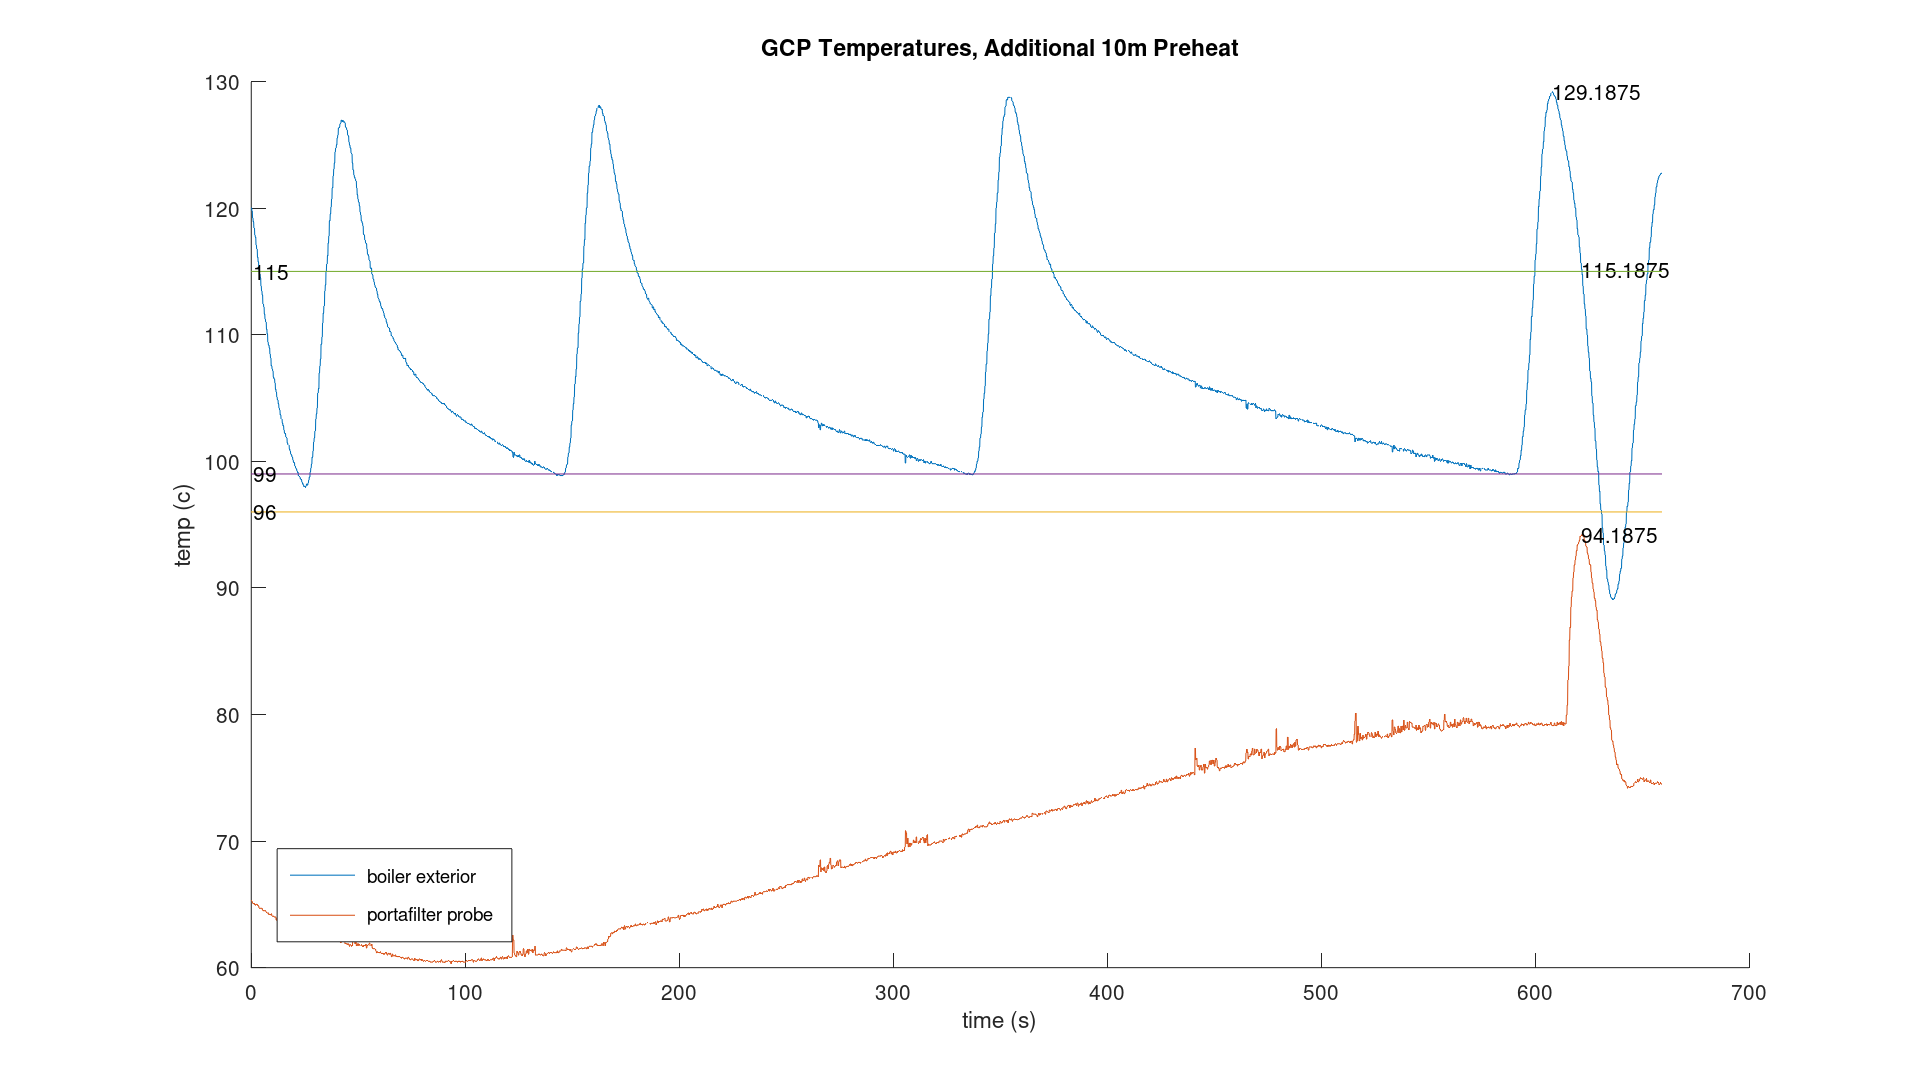
Seriously, my Octave skills are pretty bad. For now, let’s focus on the overall sawtooth pattern of the blue plot, boiler temperature. I’ve plotted lines at our threshold temperatures, 115c and 99c. Notice that it’s even worse than we might have originally thought. We can cut the power to the boiler when we sense it’s 115c, but it continues to heat up to over 125c before it starts to cool off.
An Intuitive Example
Imagine you’re driving a car, but only the passenger can see the speedometer. The speed limit is 25 mph. Every time you fall below 20 mph, your passenger yells “GUN IT!”; when you get over 30 mph, they yell “STOP!”.
A control law like this will lead to oscillations in your speed, which will never converge to the desired value. Even if we were to issue commands at 24 mph and 26 mph respectively, we might avoid getting pulled over for speeding, but we’ll surely be given a field sobriety test.
Now imagine an alternative where your passenger considers not just your current speed but also your past speed and current acceleration. Your passenger uses this to say, “Well, you’re 40% down on the pedal and 2 mph below the speed limit. You’ve been below the speed limit for 5 minutes now and your acceleration is stable. Why don’t you kick it up to 45% on the pedal?”
This is going to be a much smoother ride. If your copilot has done a good job picking their tuning parameters, you might even converge on the correct speed and stay there!
PID Control
Adding an off-the-shelf PID temperature controller is a very popular project for Gaggia espresso machines. You can find lots of guides and kits online. But I’d like to be able to add advanced features at a later date, so I rolled my own.
What is a PID controller? PID stands for proportional, integral, derivative. We set a target temperature (set point) and read a sensor to find the current temperature (our process variable). The controller takes into account
- the difference from the target temperature (proportional error)
- how far off from the target we’ve been in the past (integral error)
- how quickly we’re getting closer or farther away from the target (derivative error)
Multiply these errors by coefficients called gains, add them all up, and you get a total gain value. This gain value can then be used to calculate a value for a controlled variable.
In this case, our controlled variable might be how many milliseconds per second we want to run the machine’s boiler. A duty cycle of 500ms per 1000ms can be thought of as providing about 50% power. Depending on the system’s characteristics, it might be possible to instead pulse the boiler for 5us every 10us. Hopefully you can see how that would provide a “smoother” delivery of power to the water in the boiler. We’ll calculate values for this period in a later post.
What’s Next?
To prove we can do a lot better than the stock thermostat at the start of the post, here’s a sneak peek of a plot I produced during early testing of my custom controller.
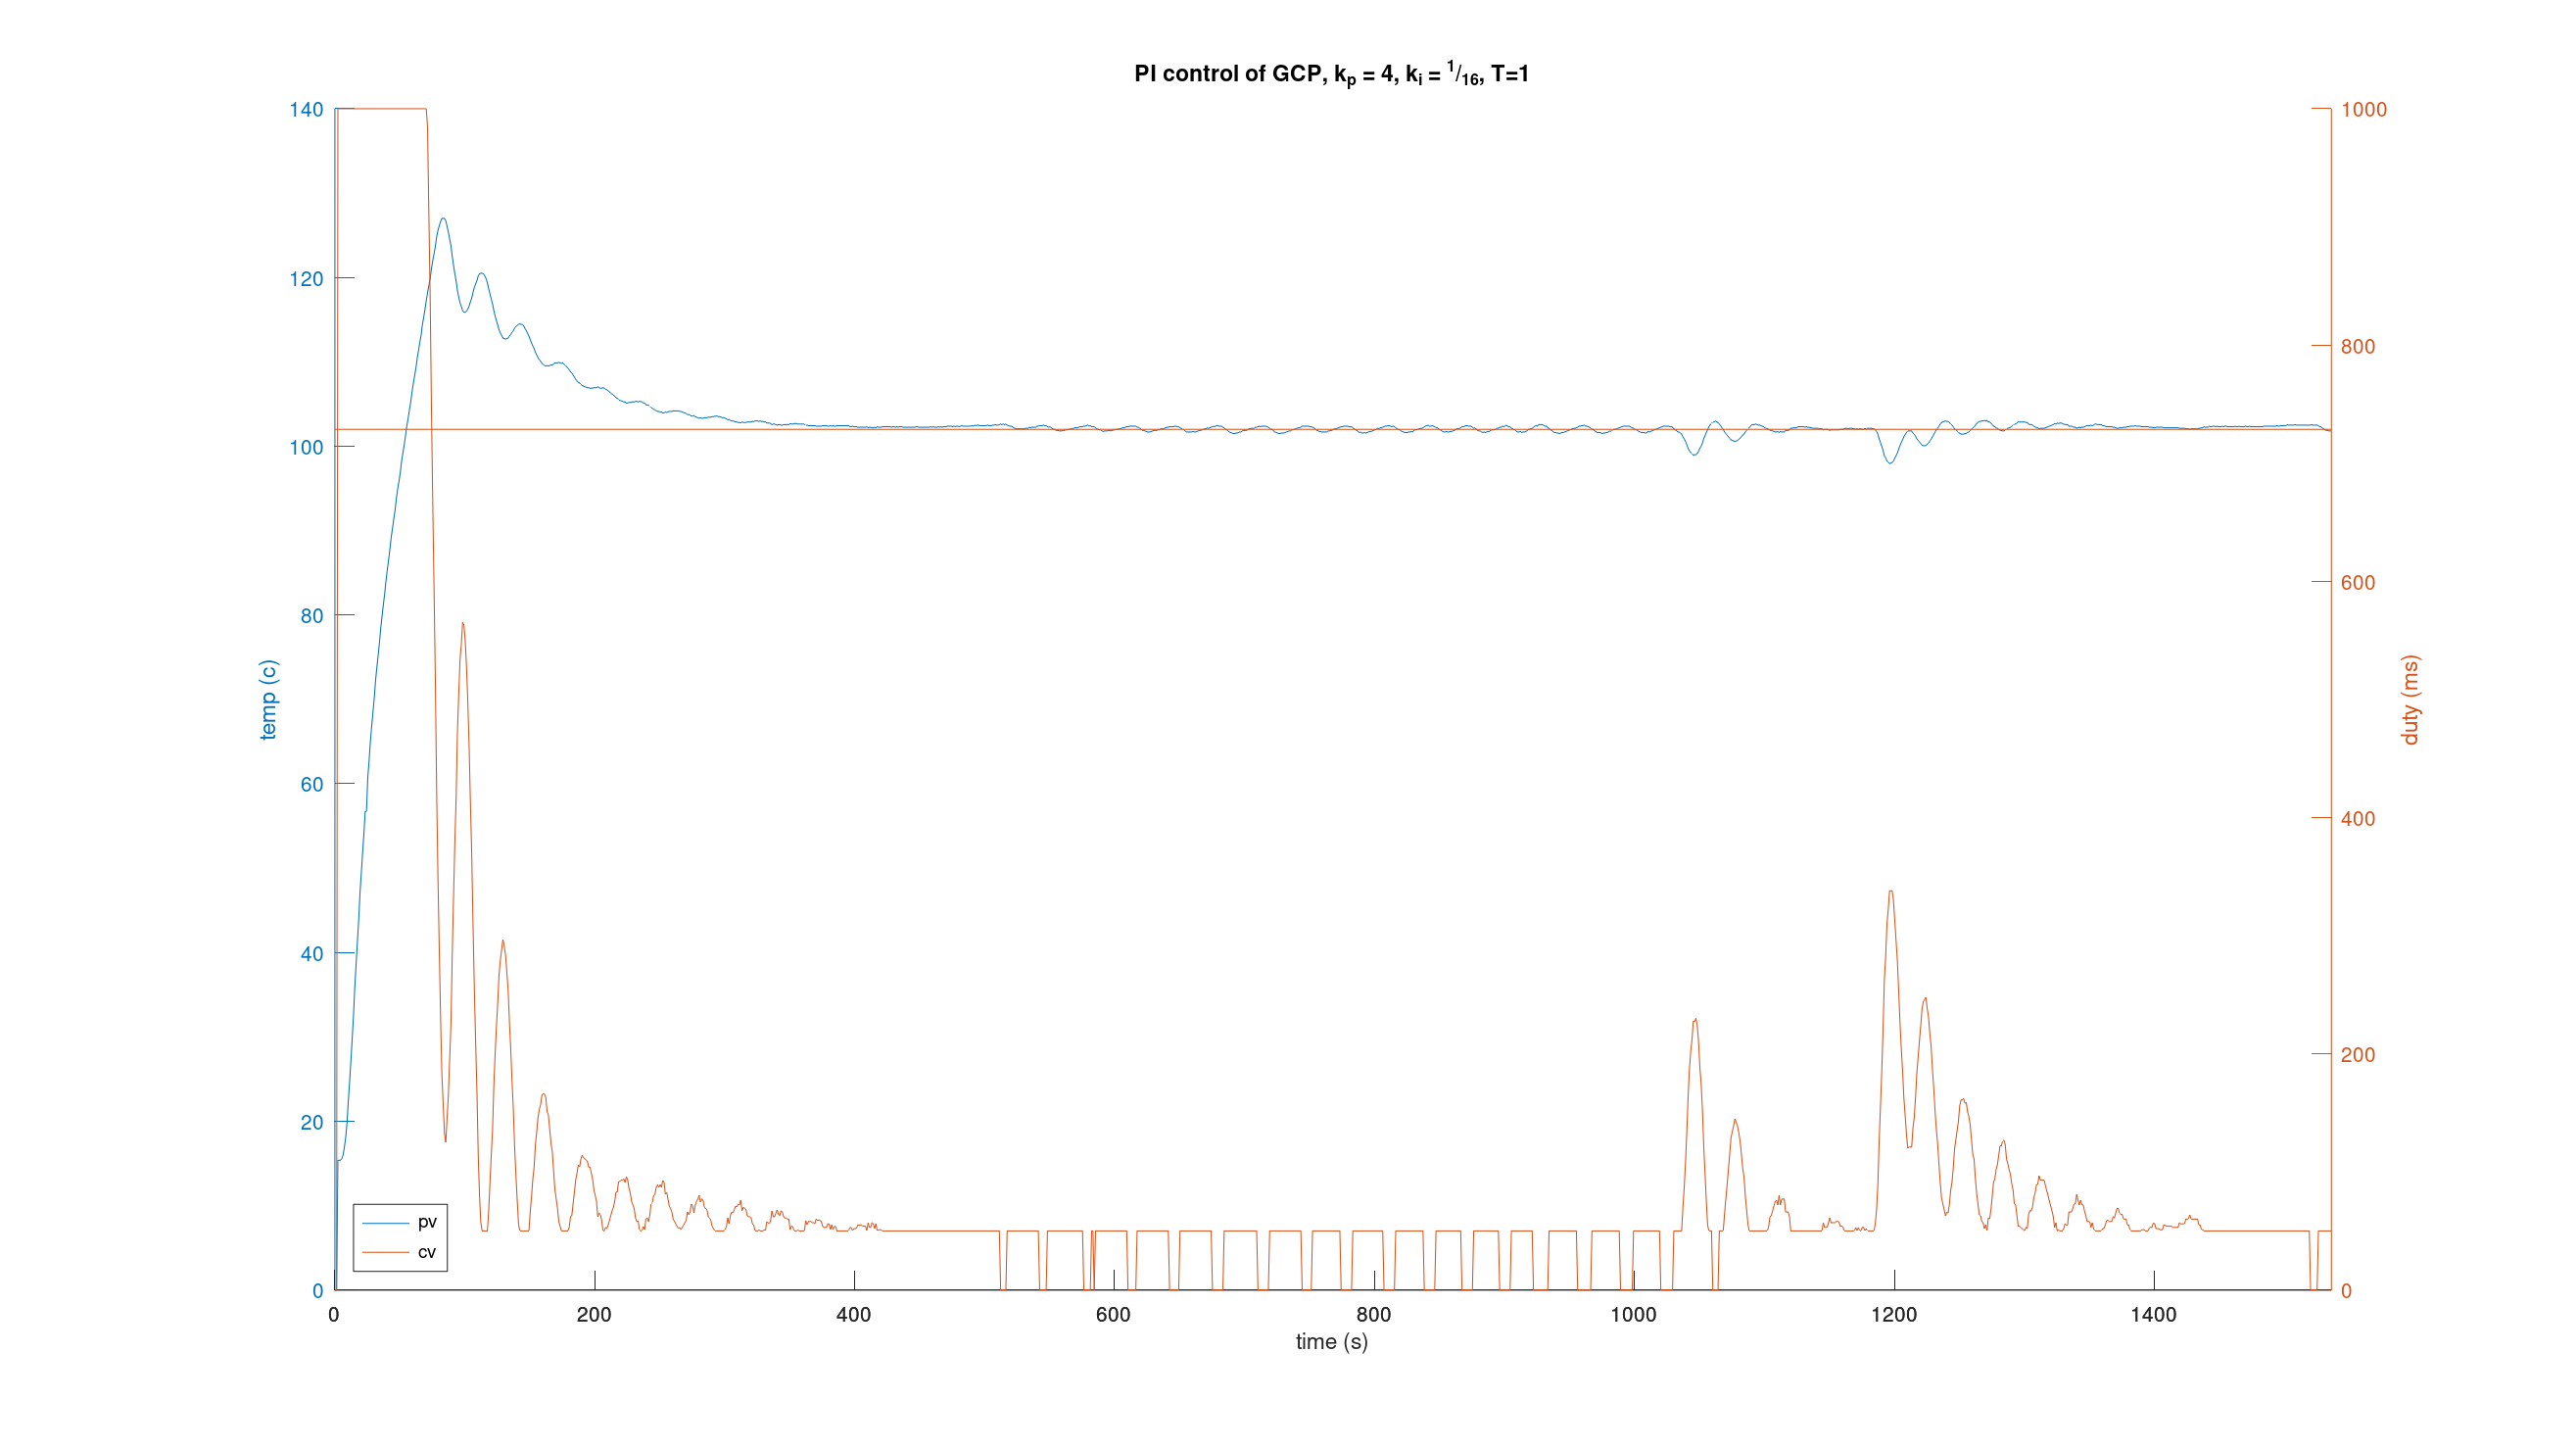
In the next post, I’ll share diagrams and photos to help you understand the electrical systems and how things are wired up, along with a list of equipment used.